


Author: Linpowave Technology Team
Date: July 26, 2025
Reading Time: Approx. 5 minutes
Introduction
Millimeter-wave radar plays a critical role in autonomous driving, intelligent transportation, and industrial automation. The reliability and stability of these sensors directly impact system safety and performance. Identifying potential risks before failures occur is essential to ensure long-term stable operation.
The Potential-Functional (P-F) curve offers a clear model of equipment health progression, helping detect the transition from latent faults to functional failures and enabling precise predictive maintenance. This article explains the P-F curve principles and how Linpowave leverages it for radar fault prediction.
Understanding the P-F Curve
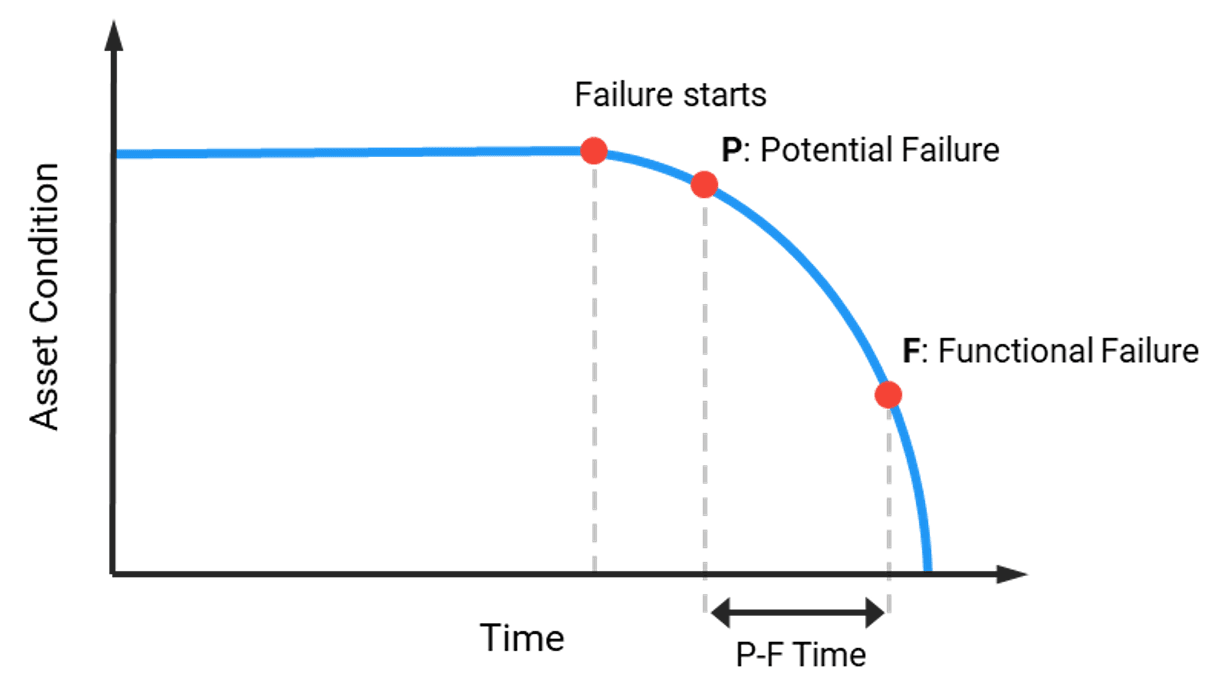
The P-F curve maps the progression from aPotential Failure (P point)—where faults first emerge but function is unaffected—to aFunctional Failure (F point)—where the device stops performing as intended.
-
Potential Failure (P point):Early signs of malfunction appear, often detectable by sensor data anomalies, but no operational impact yet.
-
Functional Failure (F point):The radar ceases to function correctly, causing system disruption.
The time between P and F points is the "P-F interval," a crucial window for maintenance intervention.
Figure 1: Illustration of the Potential-Functional (P-F) Curve
The Value of the P-F Curve in Millimeter-Wave Radar Maintenance
Proactive Phase: Extending Equipment Life
Linpowave emphasizes high reliability through premium component selection and optimized thermal management, aiming to delay the onset of potential failures and maximize the P-F interval.
Predictive Phase: Early Fault Detection
By continuously monitoring key radar parameters—such as transmit power, signal-to-noise ratio, detection accuracy, and temperature fluctuations—early warning signs can be captured. Linpowave’s integrated software platform provides real-time analytics and alerts to support timely maintenance decisions.
Fault Phase: Rapid Response
When a functional failure is detected, safety protocols trigger system shutdowns or fallback modes to prevent further damage or hazards.
Key Indicators of Potential Radar Faults
| Monitored Parameter | Fault Warning Significance | Typical Symptoms |
|---|---|---|
| Transmit Power | Component aging or damage | Instability or decline in power output |
| Signal Quality | Environmental interference or hardware issues | Reduced SNR, lower detection accuracy |
| Target Detection Stability | Sensor data anomalies | Fluctuations in range or velocity measurements |
| Operating Temperature | Poor heat dissipation or circuit faults | Sustained temperature rise or abnormal fluctuations |
| Mechanical Connections | Vibration or loose connectors | Hardware vibrations or poor contacts |
Comprehensive real-time monitoring and analysis of these parameters are essential for accurate predictive maintenance.
Case Study: Linpowave Radar Health Management in Action
A client performing autonomous vehicle testing used Linpowave radar’s real-time data acquisition to detect abnormal temperature rises and degraded signal quality early. This timely warning enabled proactive maintenance, preventing test interruptions and safety risks.
Conclusion
The Potential-Functional (P-F) curve provides a scientific and systematic framework for managing millimeter-wave radar faults. Linpowave is committed to advancing product reliability and intelligent monitoring technologies, partnering with customers to build safer and more stable sensing systems.
Looking ahead, we will integrate big data and AI technologies to enhance radar health management further, accelerating progress in intelligent transportation and industrial automation.