






Why microclimate mapping matters when a single weather station is not enough
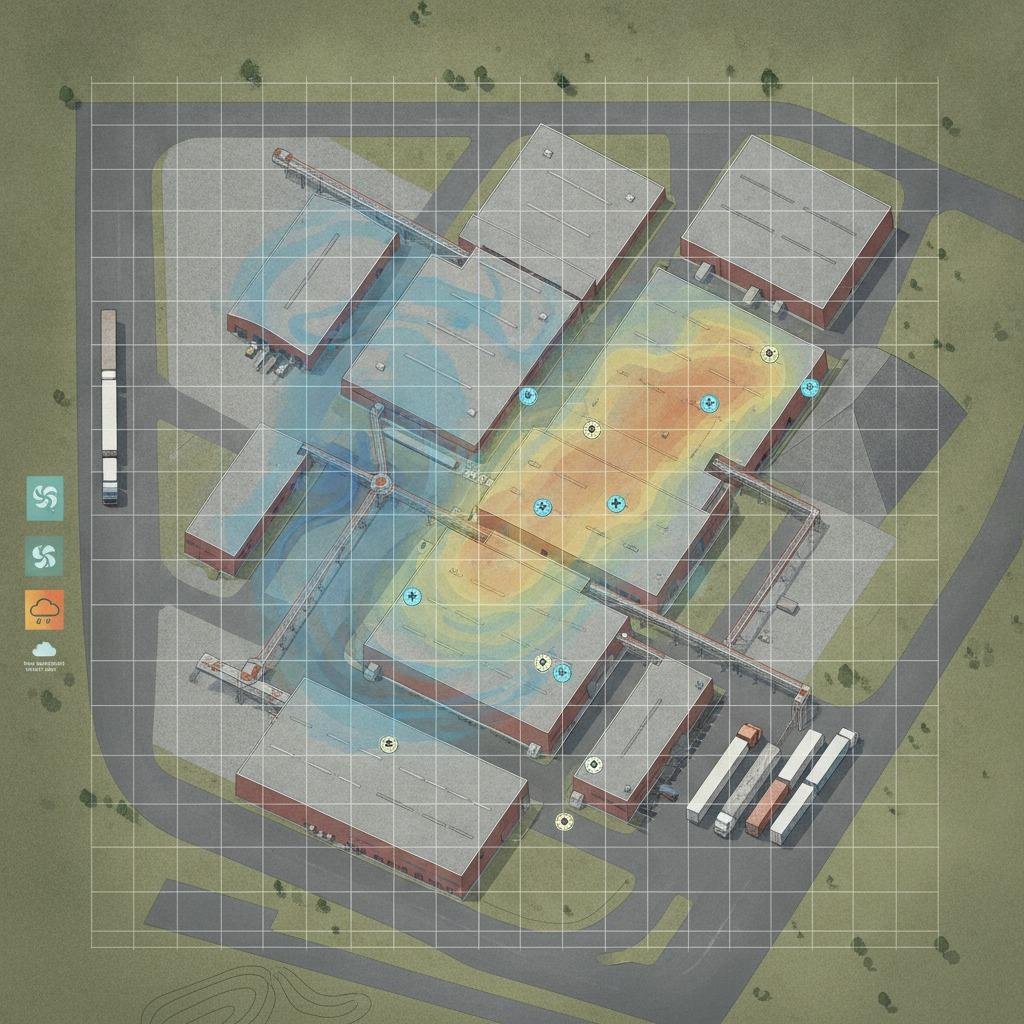
Microclimate mapping is the practical answer to a problem engineers know well: conditions can vary sharply across a site, even when a single weather reading suggests everything is stable. A rooftop may be in wind while a loading bay sits in still air. One corner of a solar field may see stronger precipitation exposure than another. For planners, operators, and product teams, that gap between the local reading and the actual site behavior can distort decisions, from system placement to risk controls.
The issue is not academic. Small-scale variation affects visibility estimation, precipitation intensity measurement, turbulence sensing, and wind shear detection. If those factors are missed, an operation can be underdesigned, a forecast can be too coarse, or an automated system can react too late. Microclimate mapping helps close that gap by turning scattered observations into a more usable site picture.
What the method is trying to solve
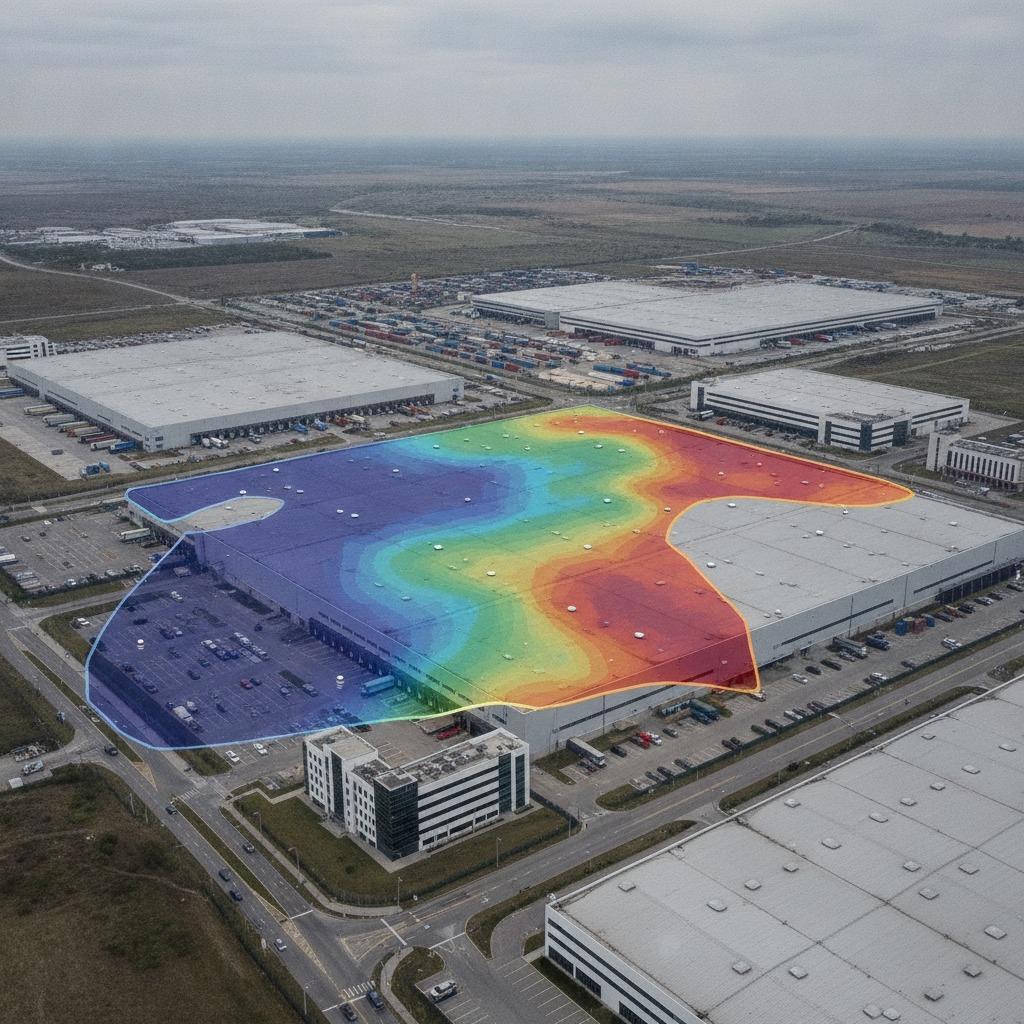
At its simplest, microclimate mapping builds a spatial profile of environmental conditions across a defined area. Instead of relying on one point measurement, teams collect data from multiple locations and compare how conditions change with elevation, obstructions, surface type, distance from structures, and time of day. The result is a map that shows where the site behaves differently, and by how much.
That matters for any business where weather affects safety, uptime, calibration, or asset life. In industrial settings, the wrong assumption about localized wind or rain can influence sensor placement, inspection schedules, and even the layout of outdoor equipment. In transportation and infrastructure work, site-specific variation can be the difference between a robust design and a recurring maintenance headache.
Useful inputs: the measurements that make the map credible
A good map depends on the quality of the measurements feeding it. The most useful data often come from a mix of environmental variables rather than a single metric. Visibility estimation helps identify localized haze, spray, or obscuration near roads, runways, or process yards. Precipitation intensity measurement shows where rainfall or snow is hitting hardest and whether a storm cell is behaving unevenly across the area.
Turbulence sensing is particularly useful around buildings, towers, elevated terrain, and wind farms, where air flow can become chaotic in ways a general forecast will not capture. Wind shear detection adds another layer by highlighting abrupt changes in wind speed or direction over short distances or height differences. Together, these inputs let teams distinguish a calm-looking site from one that is actually changing fast at the edges.
Quick reference: where microclimate mapping pays off
In practice, the strongest use cases tend to be sites with complex geometry or high exposure. Large industrial campuses, solar and wind installations, ports, airfields, logistics yards, and hillside developments all benefit from spatially resolved weather data. Any environment with hard surfaces, nearby structures, or mixed elevations can create its own local effects. That is the whole point: a site is rarely uniform enough for broad regional data to tell the full story.
One practical caution: teams sometimes gather plenty of data but fail to align it with the actual operational question. If the purpose is equipment protection, the map should emphasize thresholds and hotspots. If the purpose is routing or safety, the emphasis may shift toward visibility and wind variation. The same data set can serve different decisions, but only if the deployment plan was clear at the start.
How to approach a mapping project without overcomplicating it
The most useful projects usually start with a site walk and a simple question: what variability are we trying to reveal? From there, teams can choose sensor locations based on topography, airflow paths, obstructions, and likely weather gradients. A flat, open site may need fewer measurement points than a dense industrial yard with multiple buildings and hard surfaces.
It also helps to separate short-term snapshots from longer observation windows. A brief storm event can reveal rain intensity differences, while wind shear and turbulence often need more time to show patterns that repeat. If a project is rushed, the map may capture a moment rather than a reliable site behavior. That is a common mistake, and it is avoidable with a modestly longer observation period.
Selection criteria buyers should keep in mind
When evaluating a microclimate mapping approach, buyers should look at spatial coverage, sensor placement flexibility, data resolution, and how the information will be interpreted after collection. Raw data alone is rarely enough. The real value comes from turning it into a decision about design, operations, or risk control. Compatibility with the site’s physical constraints matters too, because a theoretically ideal placement may be impossible beside traffic lanes, equipment pads, or safety boundaries.
Common mistakes that make the data less useful
The biggest mistake is assuming one sensor can describe a complex site. Another is ignoring local obstructions such as walls, berms, equipment racks, and tree lines, all of which can distort readings in ways that matter. Teams also sometimes overread a short sampling period, especially if the weather is relatively calm during collection. That can produce false confidence, which is more expensive than missing data.
A smaller but important issue is poor communication between the people gathering the data and the people using it. If engineers, operations staff, and procurement teams are not aligned on what the map is supposed to support, the final result can be technically sound but commercially awkward.
What a buyer should ask before moving forward
Before committing to a mapping program or related instrumentation, ask what environmental variable is driving the decision, how localized the risk really is, and how the site will be segmented for analysis. Ask whether the project needs visibility estimation, precipitation intensity measurement, turbulence sensing, wind shear detection, or some combination. Most sites need more than one lens, but not every project needs every instrument.
It is also worth asking how the resulting map will be used after collection. Will it guide sensor placement, trigger alarms, support design review, or justify a layout change? That answer shapes the whole effort. Without it, microclimate mapping can turn into an interesting dataset with no operational destination.
Where the next step usually goes
For engineering and sourcing teams, the next move is usually a site-specific assessment that defines the measurement goals, the terrain or structure challenges, and the data outputs needed for decision-making. Once those are clear, the mapping effort can be sized sensibly instead of built around guesswork. That tends to save time later, which is usually where these projects pay for themselves.
If your site has uneven weather behavior, the practical question is not whether microclimate mapping is useful. It is how much uncertainty you can afford before you measure it properly.