






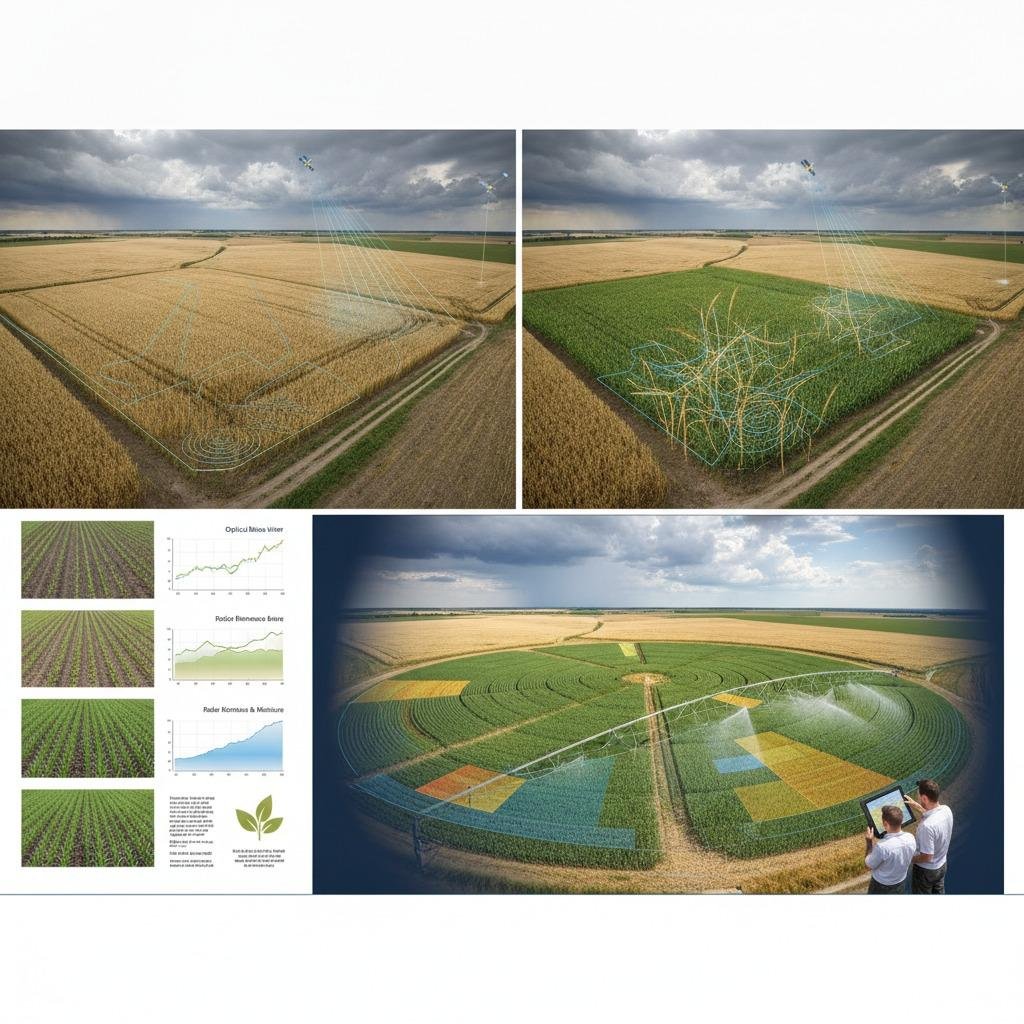
Optical vegetation indices like NDVI have carried digital agriculture for two decades, but operational teams running commodity forecasts regularly hit a wall mid-season: persistent cloud cover blinds satellites right during peak biomass development. When optical data drops out, harvest estimations turn into educated guesswork. This visibility gap is driving agronomists and geospatial engineers toward microwave remote sensing. Implementing yield prediction via radar sensing circumvents atmospheric interference entirely, giving analytics platforms uninterrupted canopy data regardless of weather, smoke, or daylight constraints.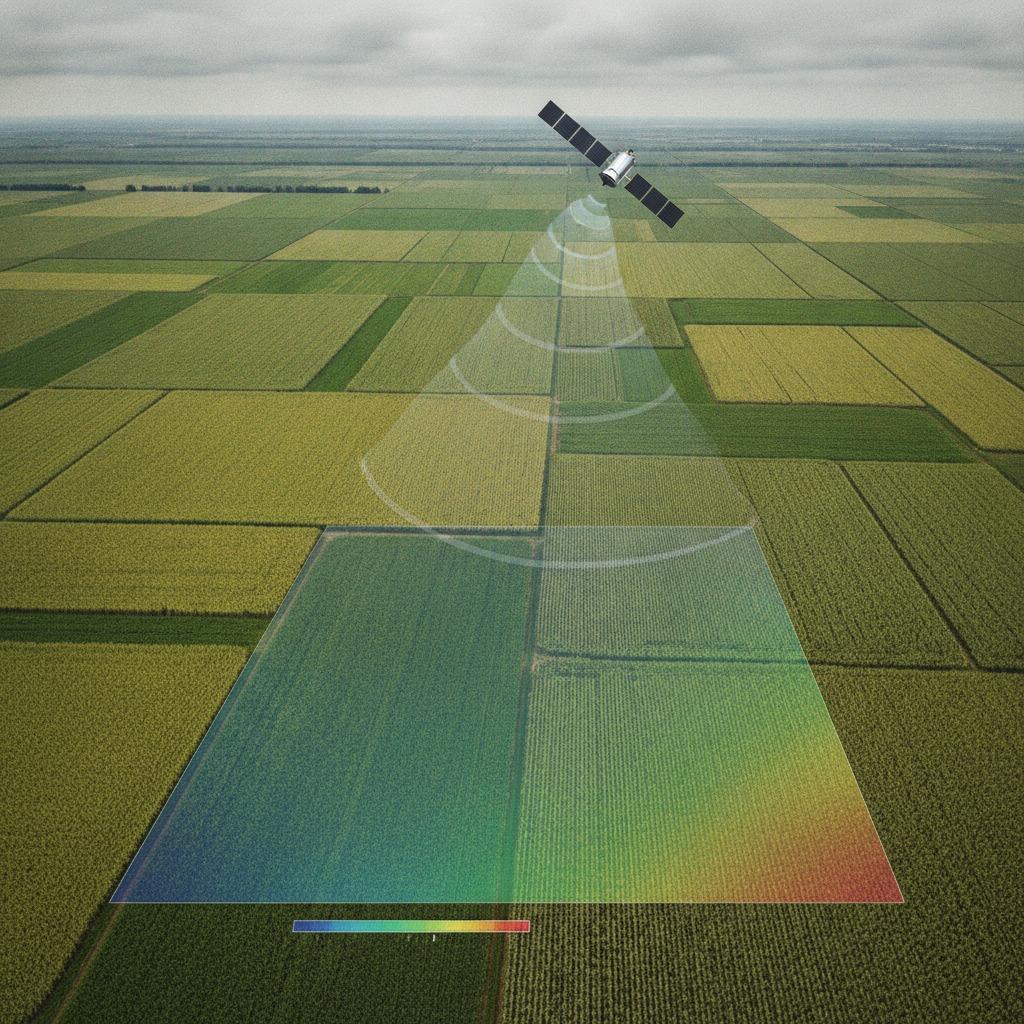
For commercial operations managing thousands of hectares, switching from optical-only pipelines to radar backscatter models isn't just about avoiding missing scenes. It fundamentally changes what you measure: radar responds directly to plant geometry, fresh biomass, and internal water content rather than leaf pigmentation.
The Limits of Optical Modeling in Dense Canopies
Traditional multispectral sensors measure reflected solar radiation, which works well early in the season when ground cover is sparse. However, once a crop reaches full canopy closure, optical indices saturate. Leaf Area Index (LAI) values above 3 or 4 register almost flat on standard reflectance curves, masking differences in ear filling, stem development, or underlying structural decay.
Furthermore, critical phenological transitions often coincide with prolonged overcast weather. In monsoon-dependent regions or maritime grain belts, a satellite constellation might not capture a clean optical image for four to six weeks during grain filling. By the time skies clear, unexpected structural damage or moisture stress has already altered potential harvest volumes beyond recovery.
How Microwave Sensing Measures Structural Yield
Synthetic Aperture Radar (SAR) transmits microwave pulses and measures the amplitude and phase of the backscattered signal. Because these wavelengths range from roughly 3 cm (X-band) to 24 cm (L-band), they interact with different physical layers of the vegetative profile:
- Dielectric sensitivity: Radar backscatter responds strongly to moisture within the plant tissue. Fresh biomass contains significant water, which alters the dielectric constant and changes signal attenuation.
- Volumetric scattering: As stalks, branches, and leaves proliferate, microwaves bounce repeatedly within the canopy volume before returning to the receiver. Cross-polarized signals (VH or HV) are particularly sensitive to this structural complexity.
- Ground-canopy interaction: Co-polarized channels (VV or HH) track the interaction between vertical stems and the underlying soil, providing clues about stand density and baseline field conditions.
By feeding multi-temporal polarimetric ratios into machine learning or mechanistic crop growth models, engineers can track the actual physical accumulation of dry and fresh weight throughout the vegetative cycle.
Expanding Applications: Lodging, Water, and Canopy Volume
Yield is rarely a straight-line function of clean vegetative growth; episodic stress and structural failure often dictate the final grain bin totals. Active radar sensors excel precisely where these physical shifts occur.
Crop Lodging Detection
Severe weather events frequently flatten cereal and oilseed crops late in the season. Severe structural collapse changes the orientation of the stalks relative to the radar beam, causing a dramatic, measurable spike or drop in polarized backscatter. Automated crop lodging detection workflows allow commercial grain handlers and crop insurers to quantify flattened acreage within hours of a storm passing, pinpointing fields where mechanical harvest losses will cut yield expectations.
Precision Irrigation Scheduling
Because C-band and L-band microwaves reflect both vegetation water and soil moisture, isolating the soil contribution through polarimetric decomposition provides an independent metric of root-zone hydration. Coupling these radar-derived surface soil moisture estimates with crop evapotranspiration models allows agronomists to drive precision irrigation scheduling. Keeping moisture within the target threshold avoids the dual yield penalties of water stress and root hypoxia.
Tree Crown Volume Estimation and Forestry
In perennial crops, orchards, and timber concessions, yield forecasting is tied directly to woody architecture rather than seasonal leaf turnover. High-resolution SAR interferometry enables accurate tree crown volume estimation, mapping the three-dimensional spread of commercial orchards and timber stands. When scaled across broad regions, this structural profiling forms the bedrock of modern forest inventory mapping, allowing timber managers to project harvestable merchantable volume without deploying costly field cruise teams.
Radar Bands: Selecting the Right Frequency for Field Monitoring
Choosing the wrong wavelength will undermine an operational analytics pipeline. Radar bands behave very differently across crop and canopy types:
| Radar Band | Typical Wavelength | Primary Interaction | Best-Fit Operational Use |
|---|---|---|---|
| X-Band | ~3 cm | Upper canopy surface, fine leaves | Early-stage emergence, vegetable crop canopy structure |
| C-Band | ~5.6 cm | Stems, leaf canopy, grain heads | Row crop monitoring, broadacre yield prediction, lodging |
| L-Band | ~23 cm | Main trunks, large branches, ground surface | Orchards, forest inventory mapping, woody biomass |
Engineering Caveats: Speckle, Roughness, and Moisture
While radar bypasses clouds, it brings its own set of processing hurdles. A recurring issue for development teams is radar speckle—the granular "salt-and-pepper" noise caused by constructive and destructive interference of the coherent signal. Aggressive spatial filtering reduces speckle but degrades the spatial resolution needed to evaluate individual field zones. Multi-temporal filtering over a dense time-series is generally the safer alternative.
Another frequent misstep is ignoring soil surface roughness. A freshly tilled field with deep tractor furrows will produce backscatter values that mimic heavy vegetative biomass on C-band sensors. Without an initial baseline surface roughness parameter or an optical mask from early spring, early-stage yield models can produce skewed biomass baselines.
Frequently Asked Questions
Can radar sensing completely replace optical NDVI data?
Not entirely. The most robust operational architectures use a fused approach. Optical data provides granular spectral response related to chlorophyll degradation and nitrogen deficiency, while radar supplies canopy geometry and water mass regardless of cloud cover. Use optical when clear skies permit, but anchor baseline structural curves in radar.
Why is C-band preferred for annual grain crops?
C-band microwaves (around 5.6 cm) are roughly the same scale as the leaves, stems, and seed heads of corn, wheat, and soybeans. This ensures the signal scatters primarily within the plant canopy rather than passing straight through to the soil (like L-band) or bouncing exclusively off the top surface (like X-band).
How does dew or heavy rain affect radar yield estimations?
Free water on the plant surface temporarily changes the dielectric properties of the target, leading to backscatter spikes that do not reflect true biomass growth. Operational processing pipelines should cross-reference local surface weather data and flag scenes captured immediately after heavy precipitation.
Structuring Your Pipeline
Transitioning from optical monitoring to radar-based prediction requires calibrating backscatter against local, physical field measurements. Rather than attempting a wholesale rewrite of your yield pipeline, begin by integrating Sentinel-1 C-band cross-polarization ratios into existing crop models during the cloudiest growth stages. Validating those outputs against ground yield-monitor data from combine harvesters provides the foundation needed to deploy automated, weather-resilient forecasts at scale.